In 2015, former Major Leaguer Lenny Dykstra went on Colin Cowherd’s radio show and claimed that he used to hire private investigators to find dirt on umpires. The intention of doing so was to turn that dirt into a more favorable strike zone for himself. You can find the clip here.
"It wasn't a coincidence I led the league in walks the next few years." - Lenny Dykstra
Over at Fangraphs, Sheryl Ring wrote an interesting article exploring whether Dykstra's claims would amount to extortion in a legal sense. In order to do so, she needed to start by assuming that Dykstra's claims were truthful, though both Sheryl and Fangraphs commenters wondered whether there is any objective evidence that Dykstra benefitted.
That's the question I'd like to explore in this post. Did Lenny Dykstra benefit from a more favorable strike zone? What do his numbers say?
Since PITCHf/x wasn't around when Dykstra played, we can't look directly at balls and strikes called against him. However, we can use his career numbers and some Bayesian statistics to generate expected walk totals.
Analysis
On the show, Dykstra's statement about "leading the league in walks the next few years" gives us a clue as to when this might have started - 1993 - the only year he led the league in walks.
Up until 1993, Dykstra had walked 384 times in 3,667 plate appearances - good for a walk rate of 10.5%. In 1993 and 1994 though, his walk rates climbed to 16.7% and 17.6%, respectively. How likely were those numbers based on his career up until those points?
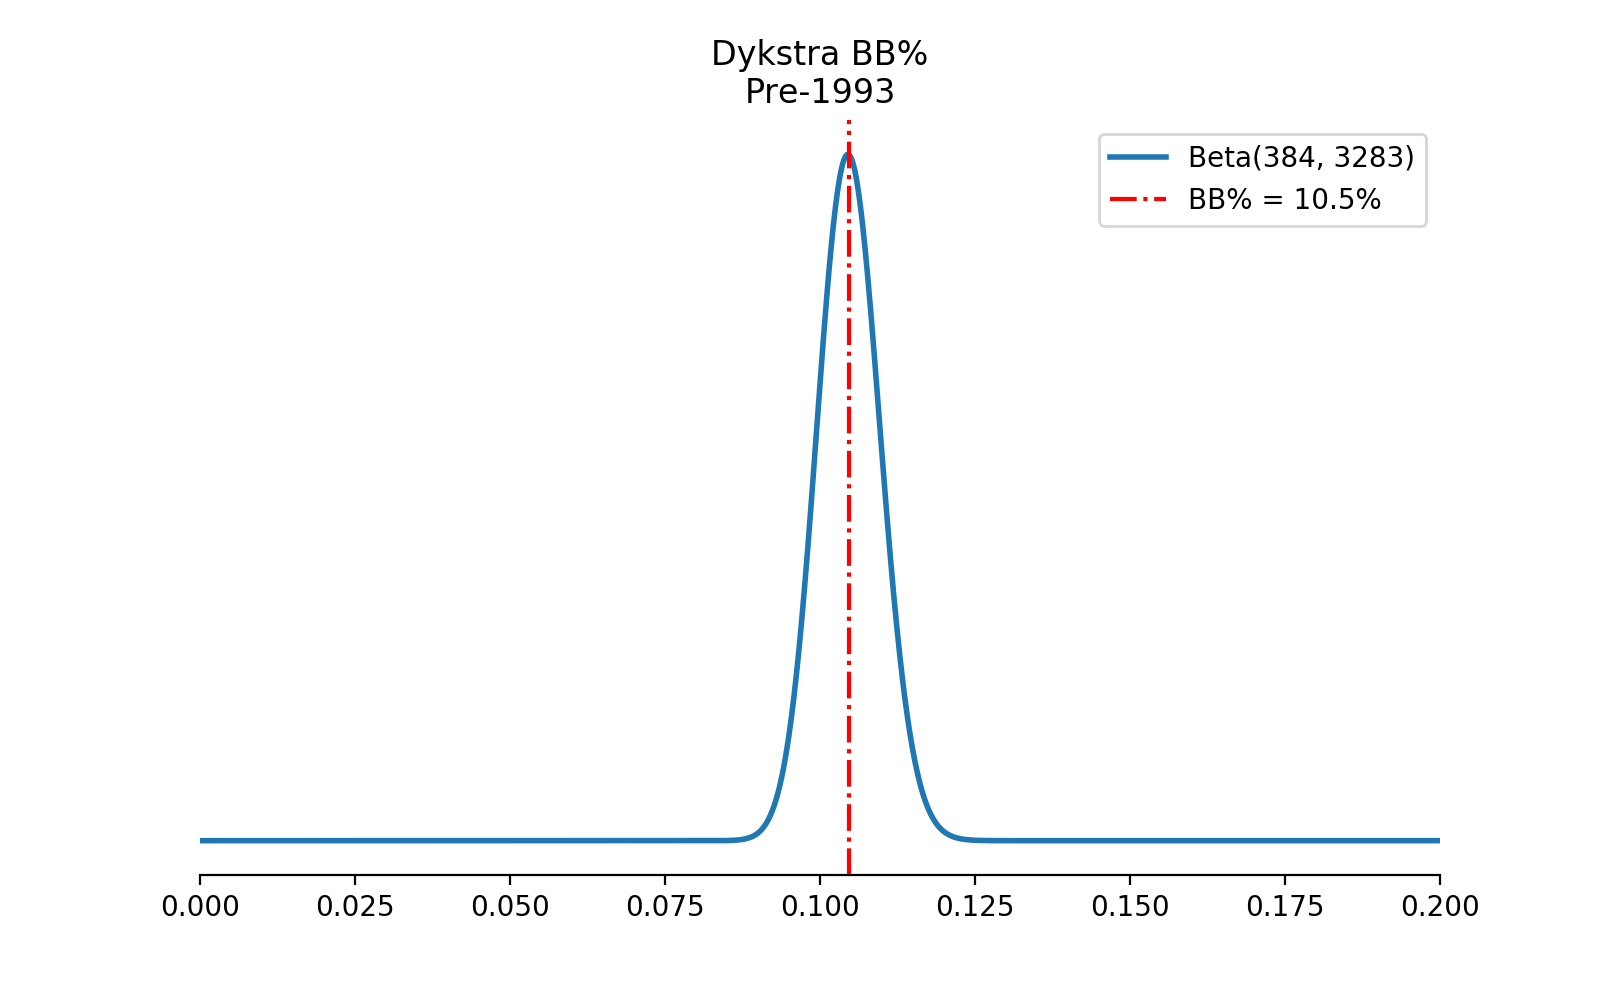
It's safe for us to assume that his "true" walk rate at that point was somewhere around 10.5% - this was his career BB% and we had a lot of data in support of it (3,667 PAs)
We can model this assumption about his "true" ability to draw a walk as a beta distribution using his pre-1993 numbers as the parameters of our model. Note that a beta distribution is parameterized by α, which represents the number of successes of an event, and β, which represents the number of failures for the same event.
\begin{equation} Beta(α, β) \end{equation} \begin{equation} Beta(BB, PA - BB) \end{equation} \begin{equation} Beta(384, 3283) \end{equation}
In this case, α is Dykstra's total walks prior to 1993 and β is the number of times he did not draw a walk during that same period.
Using this beta, we can simulate the range of values we'd expect his 1993 walk total to fall within, based his number of plate appearances from that season. This gives us both an idea of his expected 1993 BB% as well as his total walks.
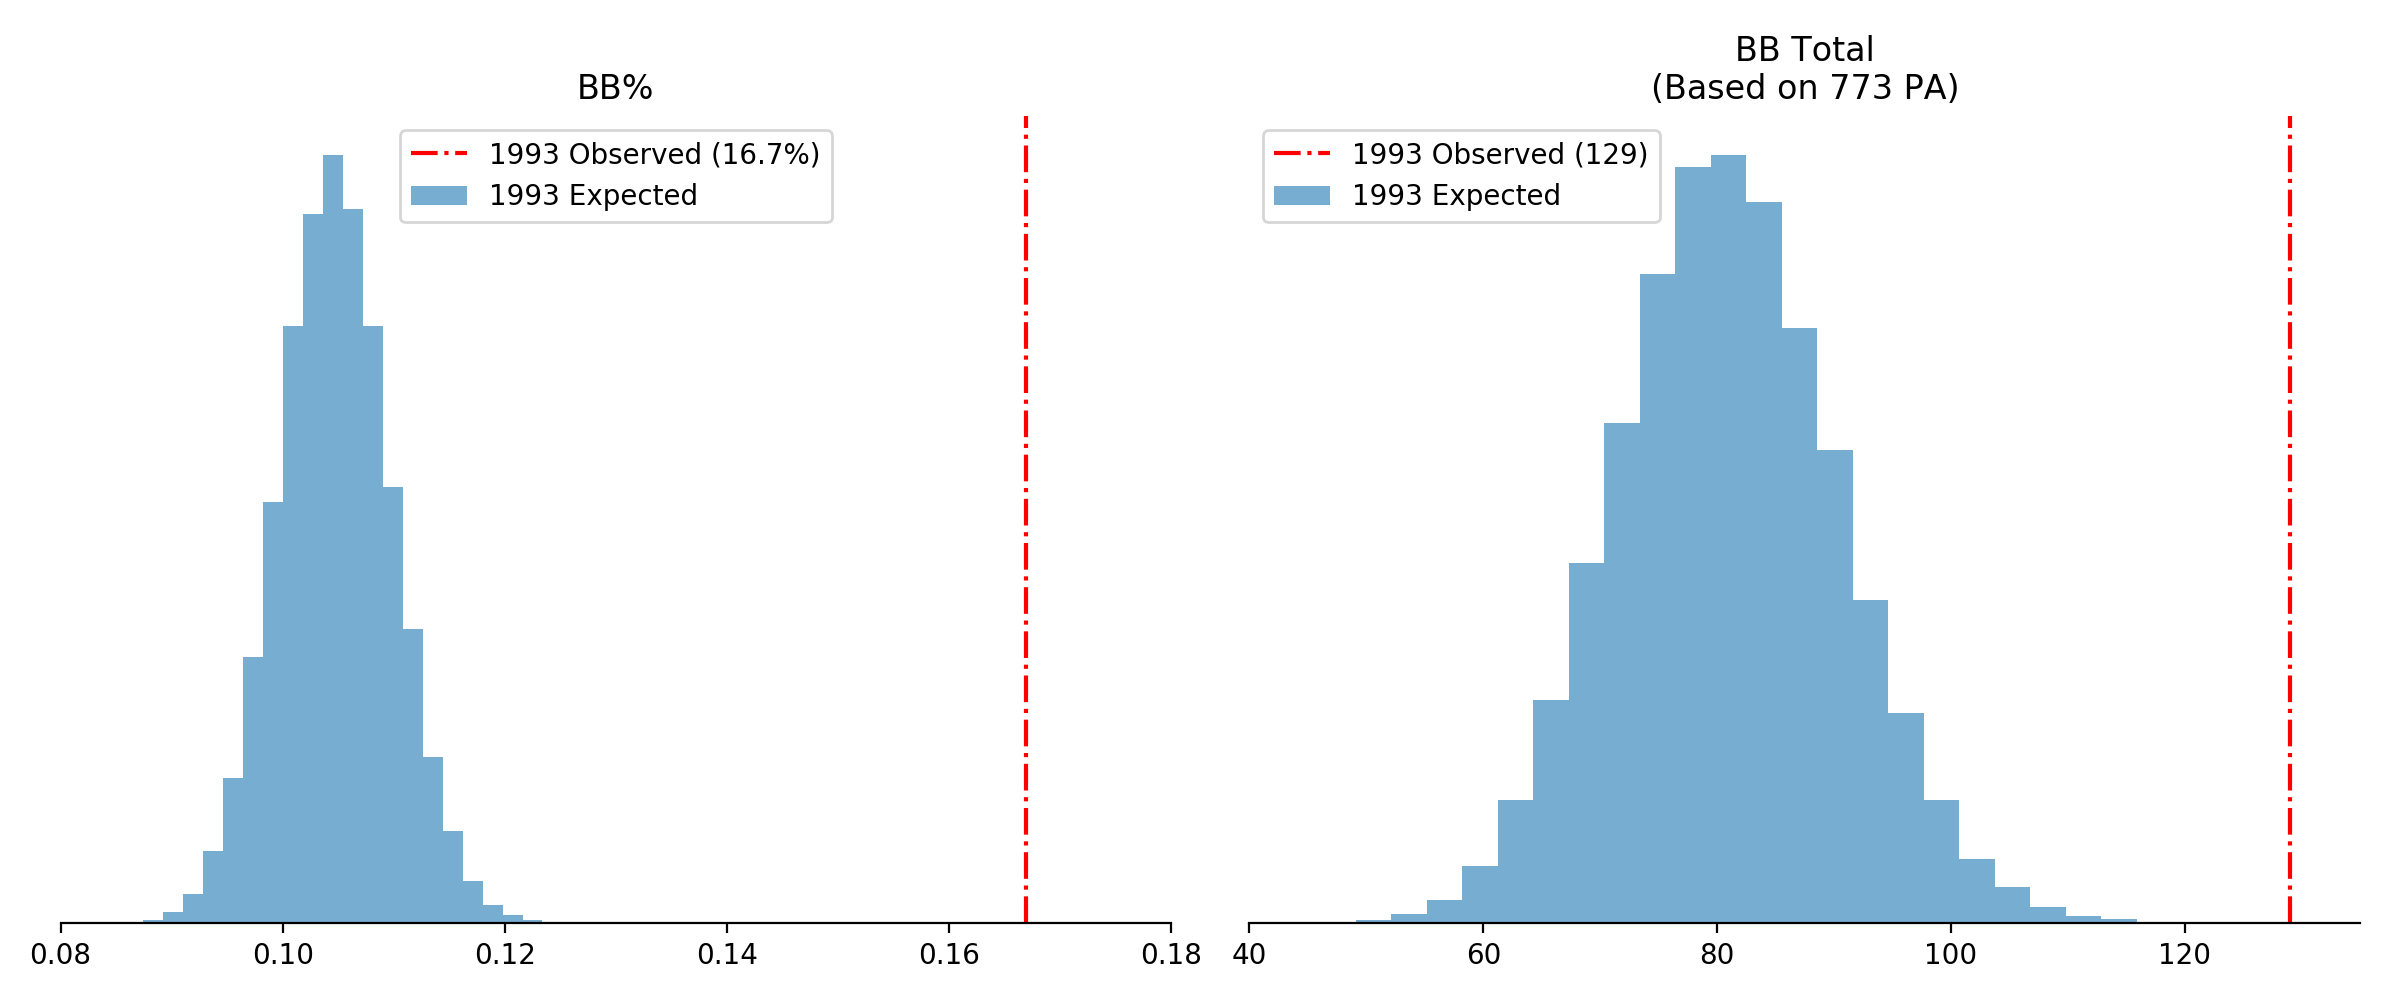
On the left, we've simulated the range we'd have expected his 1993 BB% rate to fall within, based on his career numbers up until that point. Using this range, we can then obtain an expected distribution for his total walks, based his total plate appearances in 1993 (shown right).
You'll note that the red lines indicate Dykstra's 1993 numbers, which fall well outside of our expected ranges, indicating that in none of our simulations did Dykstra match his 1993 numbers.
Taking this approach a step further, we can update our beta distribution to include the 1993 season, allowing us to understand what we'd have expected in his 1994 season.
\begin{equation} Beta(384 + 129, 3283 + (773 - 129)) \end{equation} \begin{equation} Beta(513, 3927) \end{equation}
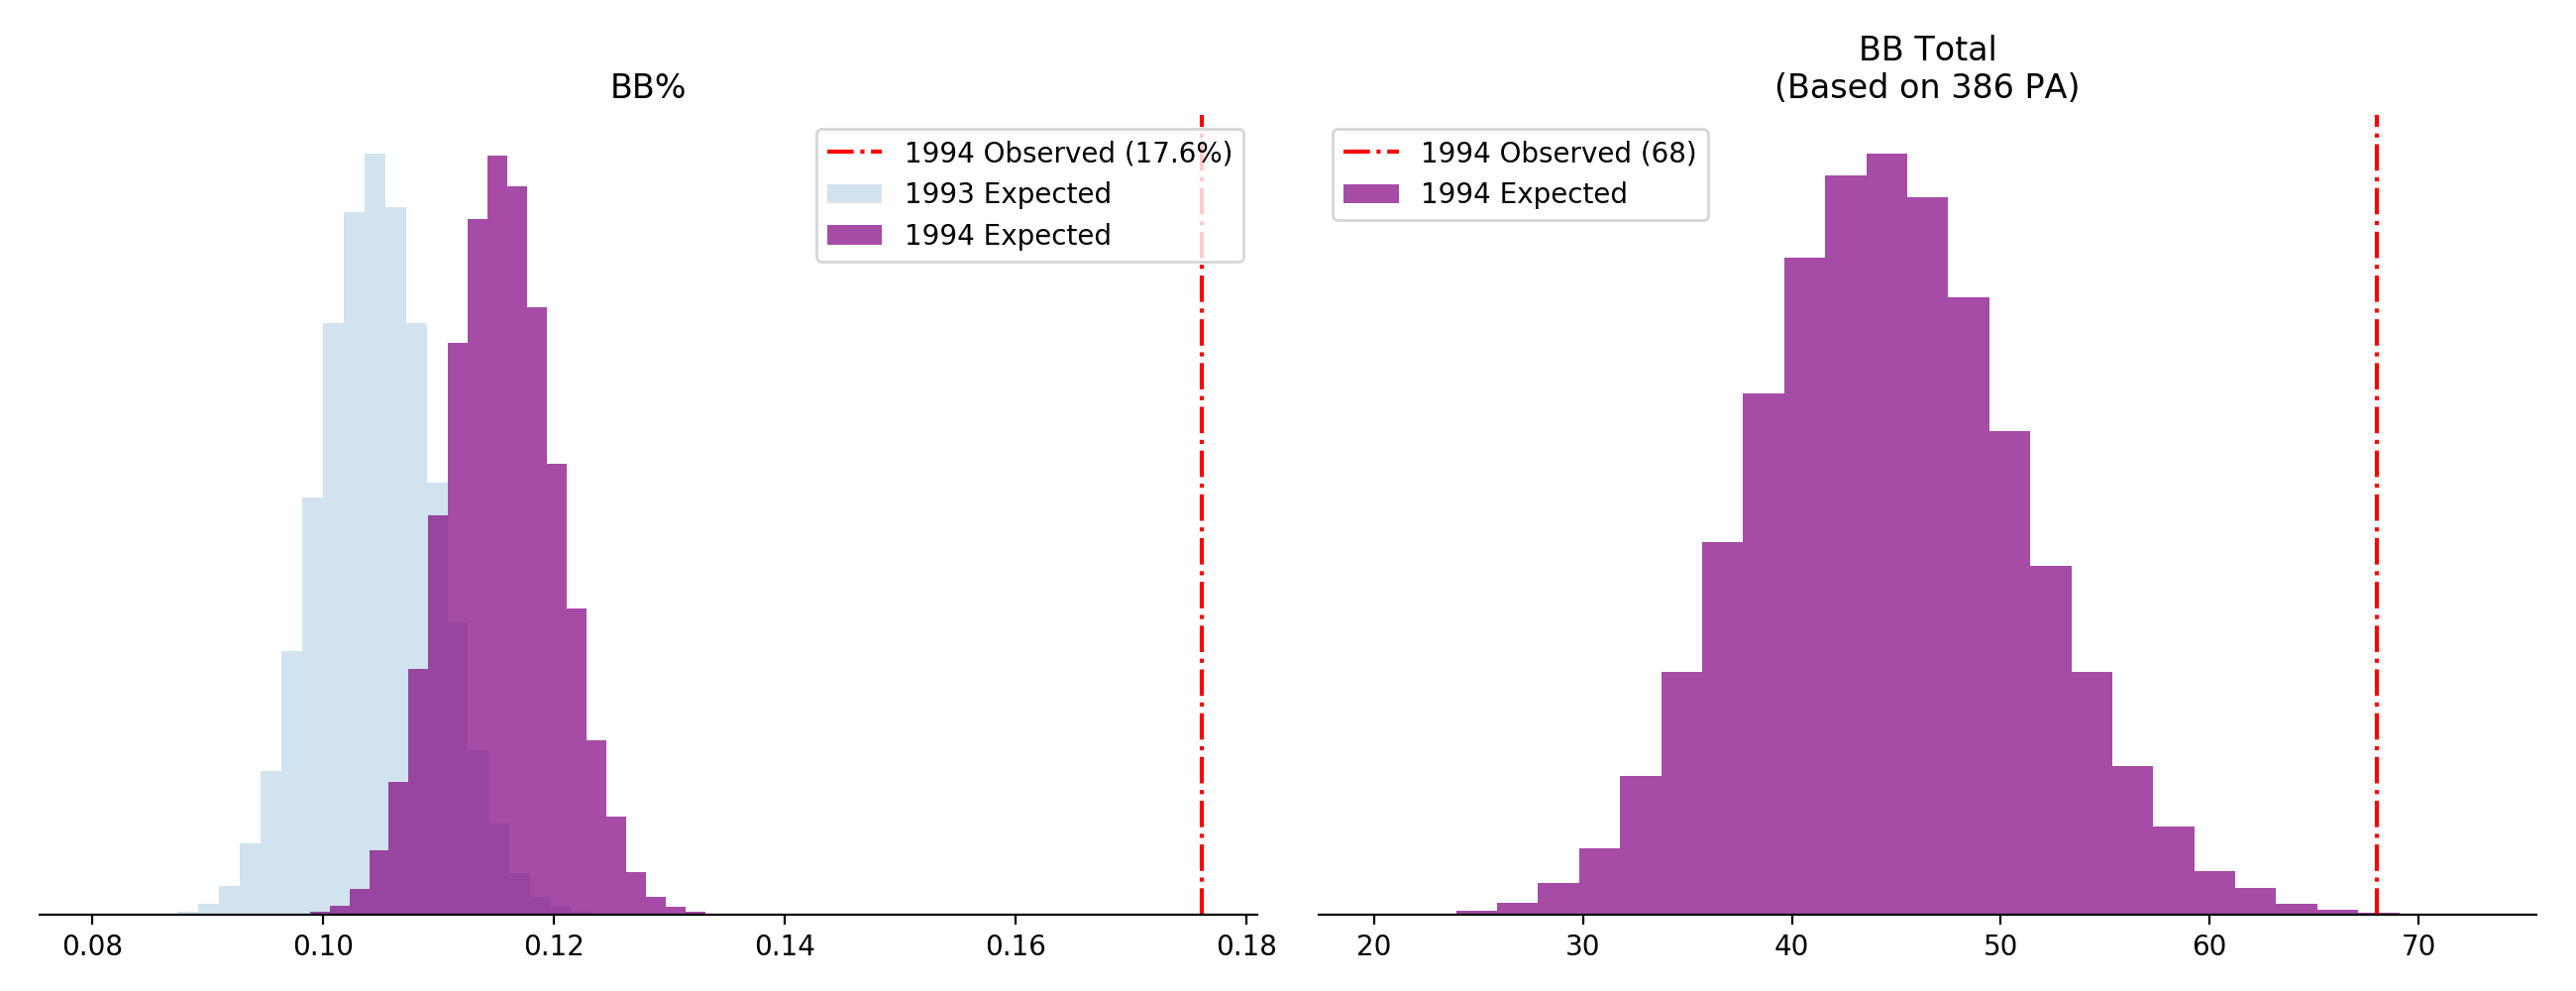
You'll note that the chart on the left includes our previous beta distribution in light blue, which is based on his career up until 1993. When incorporating his surprising 1993 walk numbers, our expected BB% shifts to the right, resulting in the purple distribution shown -- 1993 has given us new evidence to suggest Dykstra has a better eye.
Still, updating our model to include 1993 does not result in numbers we would have expected for 1994. In only 0.02% of our simulations did Dykstra achieve the 68 walks he produced in 1994.
Said differently, he did probably have some dirt on umpires, resulting in a more favorable strike zone.
It's reasonable to ask whether or not the league-wide walk rate changed around the 1993 and 1994 seasons. It didn't, ultimately staying relatively constant throughout Dykstra's career.
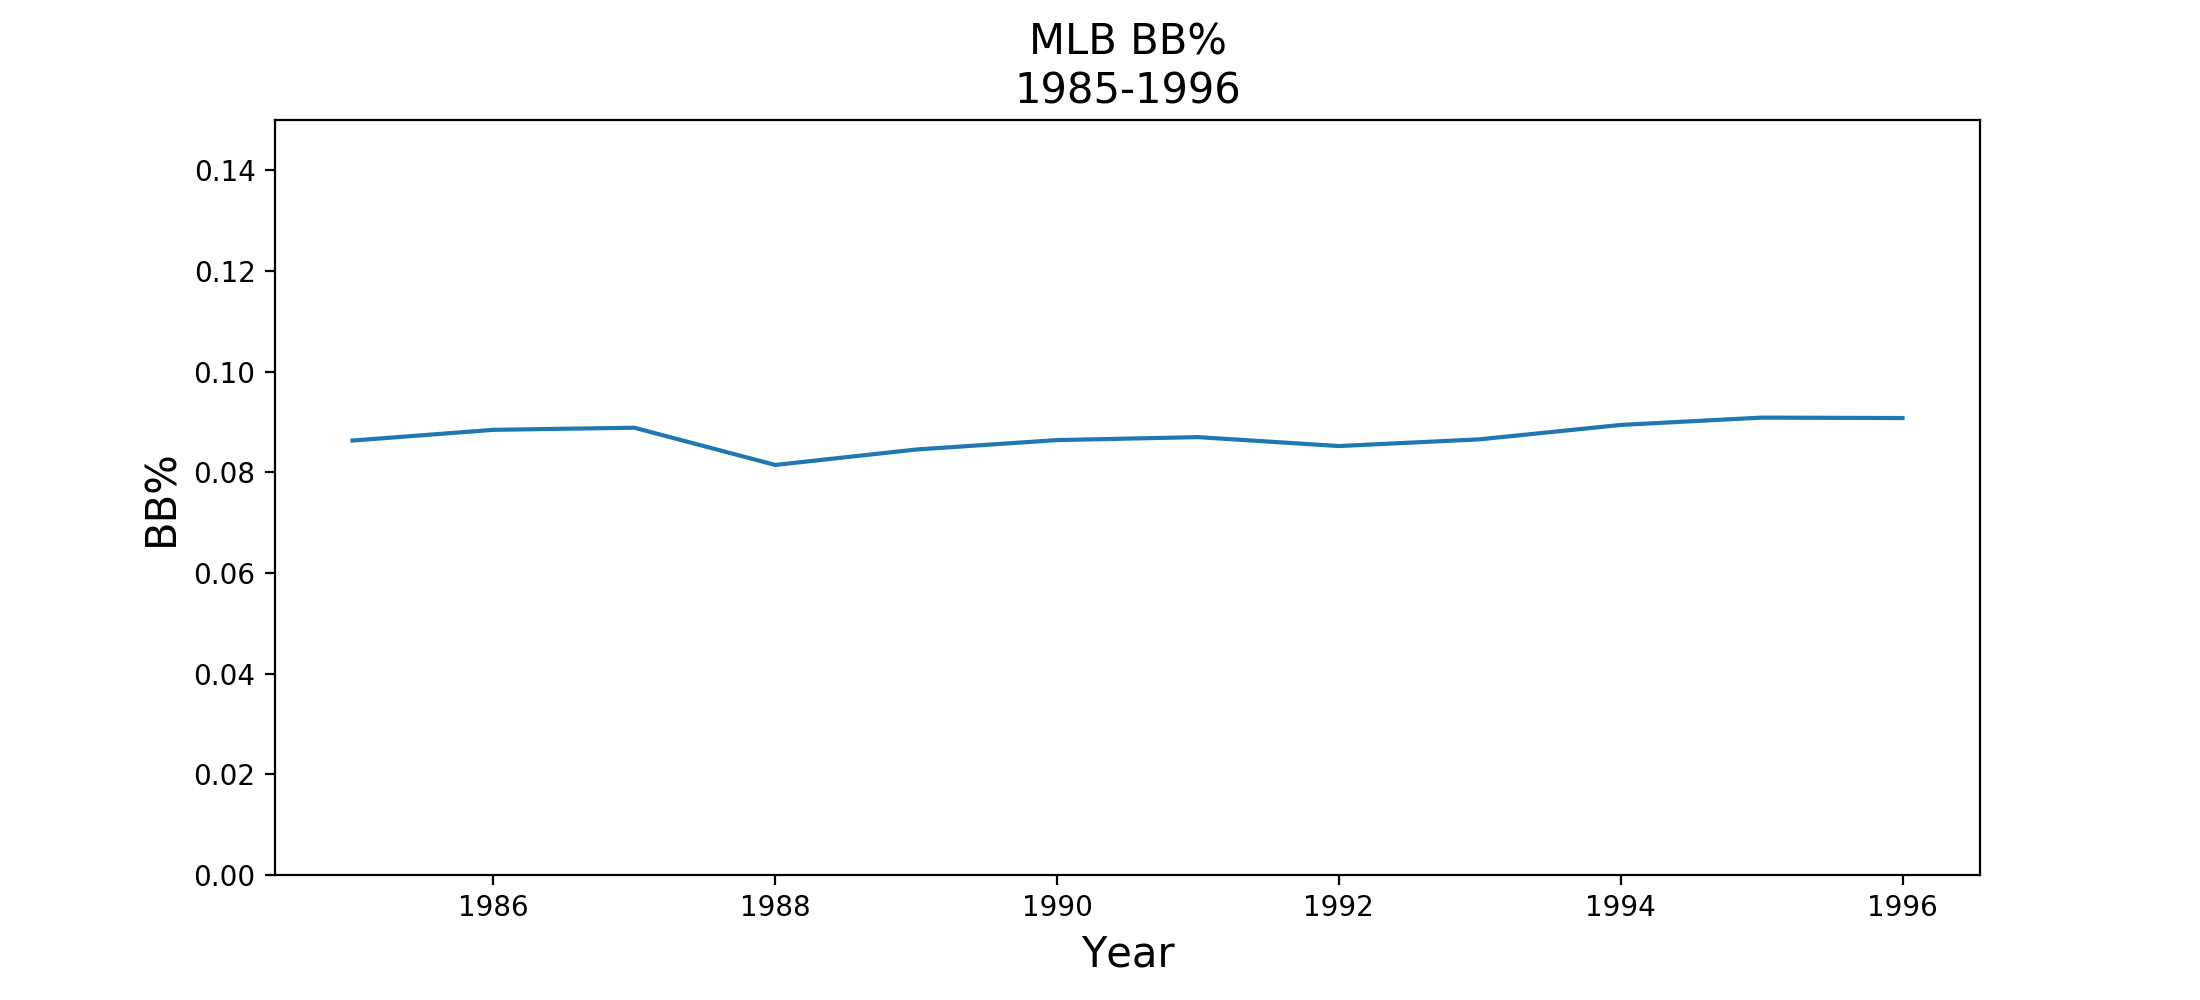
While it’s possible that his eye improved mightily between the 1992 and 1993 seasons, it's highly unlikely. As the analysis above shows, his walk numbers fall well outside of what we would have expected.
You can find the code and data for this analysis here.